A Chord diagram in Angular
I'd like to share some techniques I use to make visualisations with Angular. I see plenty of examples or even libraries that match D3 with React but not so many for Angular, so hopefully this example helps someone out.
This example combines D3 and Angular to generate a Chord diagram. We will be using D3 to do the maths and the SVG path calculations, and handing over to Angular to do the rendering and handling the DOM.
The code is on GitHub here: https://github.com/StrangeCargo74/ChordDiagramAngular
..and there is a running version here: https://chord-diagram-angular.vercel.app
Ok, so let's get started...
The data to visualise
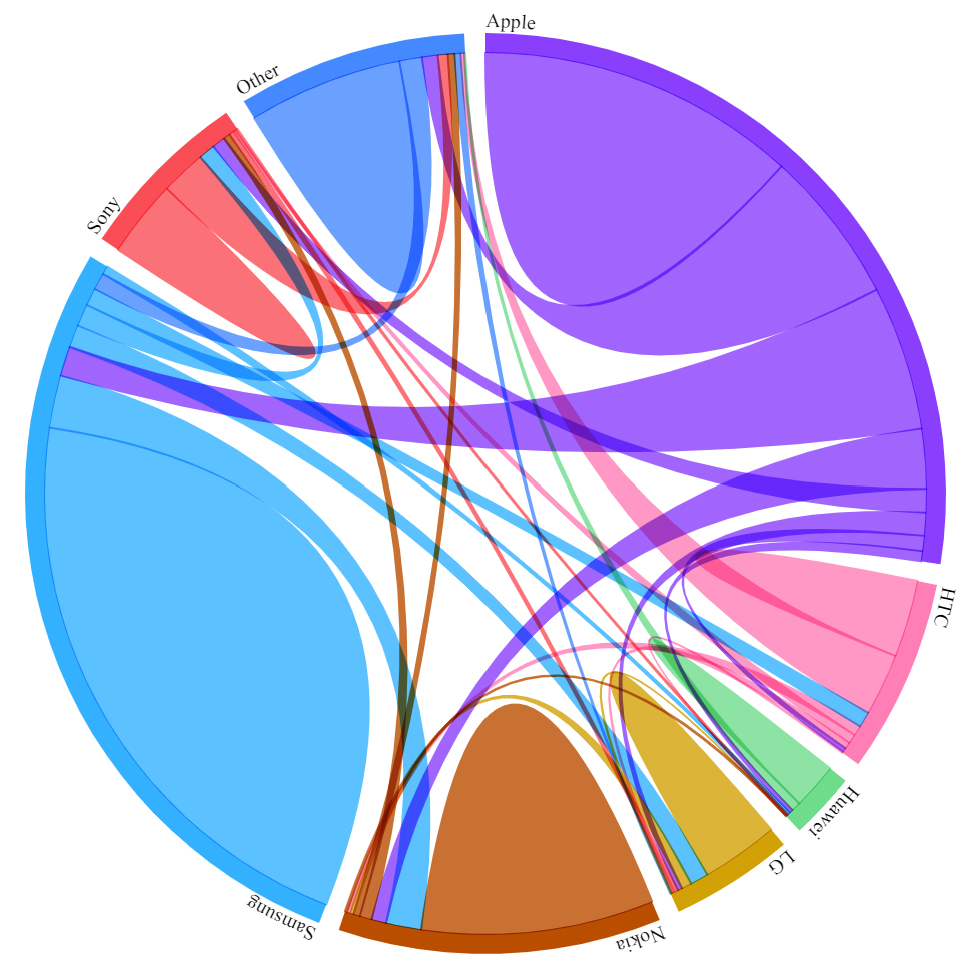
The data, shared by Nadieh Bremer https://www.visualcinnamon.com/2014/12/using-data-storytelling-with-chord/ is from a mobile phone consumer survey where respondents indicated their current mobile phone brand, and the brand of their previous mobile phone. This is great data for a chord diagram as we can visualise how the respondents switched between the phone brands.
The phone brands
This chord diagram has two main parts. Firstly there is the outer ring which is a circle with a number of arcs that we're using to visualise the mobile phone brands. Each arc has a label and a colour. There is no order in the phone brands, and so I've used a categorical (qualitative) colour palette to give a distinct colour to each brand.

To make this we will need a typescript class that handles the data, usually called a model or a viewmodel, depending on your background. There is one viewmodel per brand, and there are a few brands, so we'll have an array of brand viewmodels. We can use D3 to work out the arc and provide us with the path geometry. I'll create an Angular component that creates a SVG group that contains this outer ring.
Visualising the flow between brands
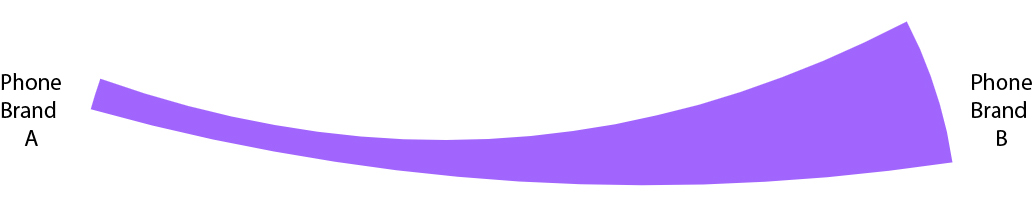
To visualise the flow of customers between these brands we are going to need some chords, the pieces that give the diagram it's name. This chord shows the flow left to right, where more customers have switched from the phone brand A to phone brand B than the other way around.
If you're not sure why I am dividing it up into components and viewmodels:
- it's good to have the logic separate from the view because it's easier to write unit tests;
- dividing it prevents us having a massive heap of spaghetti code as the functionality grows;
- when working in a team it's clear where the code lives when you didn't write it yourself.
- Other clever reasons I can't remember right now!
Bringing it all together
So, we'll use a viewmodel that corresponds with the entire diagram, and that will contain the phone brands and the chord viewmodels:
1    public phoneBrandVms: Array<PhoneBrandViewModel> = [];
2    public chordVms: Array<ChordViewModel>=[];
.. And in the chord diagram component we will render it all to an SVG like this:
 1
 2<svg width="500" height="500" viewBox="-250 -250 500 500">
 3    <g app-phone-brands [phoneBrands]="chordDiagramVm.phoneBrandVms"></g>
 4    <g id="chords">
 5        <path class="chord-path"
 6		*ngFor="let chord of chordDiagramVm.chordVms"
 7            [attr.d]="chord?.path" [attr.fill]="chord?.sourceGroup?.colour"
 8            [attr.stroke]="chord?.sourceGroup?.colour" opacity="0.8">
 9            <title>{{ chord?.tooltip}}</title>
10        </path>
11    </g>
12</svg>
That's it! For full details of how to get the d3 working In Angular look at the code. Note that to tell typescript what the shape of the d3 library is like for type-checking, install types like this:
1npm i --save-dev @types/d3-chord @types/d3-shape @types/d3-array
References and inspiration:
https://github.com/d3/d3-chord
https://observablehq.com/@d3/chord-diagram
https://www.visualcinnamon.com/2014/12/using-data-storytelling-with-chord/